Algebra 1 MVHS Where are the Probability and Statistics Standards
UNIT 3
Part A: Linear Functions
1. Rate of change
6. Linear Regressions
UNIT 3
Part A: Linear Functions
1. Rate of change
- Slope formula
- Rate of change word problems
- Slope formula
- Graphically
- Vertical/horizontal
- Comparing slope values to steepness
- Given an equation create a table and a graph
- Deciding the given representation is linear/nonlinear
- Compare the same x value for two different representation of two lines
- Stress the fact that the same line can be written all three ways
- Given two points
- Given slope and point
- Given a graph
- Given a table
- Finding intercepts and slope from all forms
- Writing equations of Lines (This should be review - did in 8th grade)
6. Linear Regressions
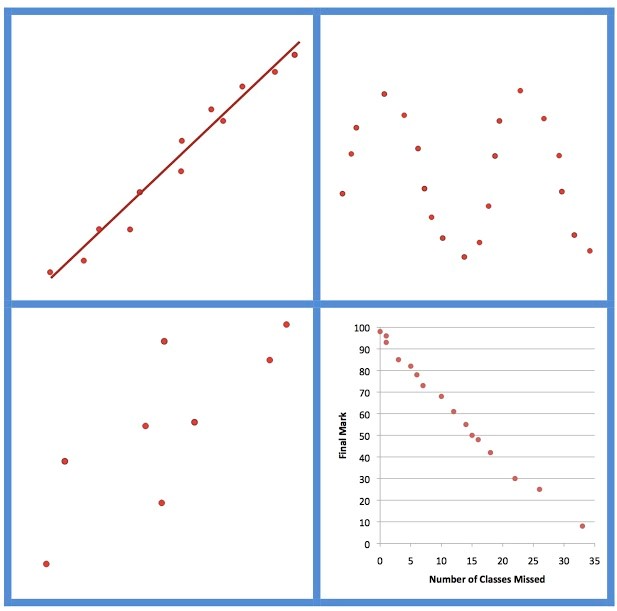
- Scatterplot
- Line of Best Fit
- Residuals
- Correlation
Algebra 1 UNIT 7
Day 1 – Dot/Box Plot (Migraines)
a.Using a dot plot (which students have done from years past) to create a BOX plot. Help the students understand the structure and USEfulness of a box plot
b.Use the box plot to answer questions about the data
c.Ending with explanations about what the data tells you…..
Day 2 – Box Plot/Histogram
Practice day
Day 7 – Stats Review
Day 8 – Assessment
Add Empirical Rule as time allows!
Day 1 – Dot/Box Plot (Migraines)
a.Using a dot plot (which students have done from years past) to create a BOX plot. Help the students understand the structure and USEfulness of a box plot
b.Use the box plot to answer questions about the data
c.Ending with explanations about what the data tells you…..
Day 2 – Box Plot/Histogram
- Review what students discovered yesterday about BOX plot. Provide formal notes to summarize the structure of a box plot
- Create a Histogram (which students have done from years past) using the same data set
- Now students have the same data represented in 3 different ways!
- Discuss the “usefulness” of each representation, compare and contrast each representation...when should each be used?
- Intro with some type of Matching Activity – if using the one provided, begin using only #1-4. Let students work in groups to match description, quartile info, box plot, and histogram. Add the challenging #5+ to your groups that are being more successful!
- Either as a class or as groups check their answers and discuss why/how they made their “matches”
- Class discussion about the shape/center/spread of data – Skew right, Skew Left, Symmetric Distribution
- Start talking about outliers and their effects on the data as time allows.
- Discuss different data sets which are “skewed” by outliers – a neighborhood house market, baseball salaries, something with students?
- After looking at the data try an activity….what happens if we take out A Rods Salary is a great one attached to do this!
- Ask a question (yes or no) relative to your students that will generate a Two Way Frequency table
- Use the tables to have students create/generate questions regarding the data. “Now that we have this table, what can you ask?”
- Create more Two Way Frequency tables by asking a new question.
- Repeat c as many times as you want/need
Practice day
Day 7 – Stats Review
Day 8 – Assessment
Add Empirical Rule as time allows!
Algebra 2 Trig & Stats
CCSS: HS: Stats/Prob UNIT 8A: Probability
Conditional Probability & the Rules of Probability
HSS-CP.A. Understand independence and conditional probability and use them to interpret data
DiHSS-CP.A.1. Describe events as subsets of a sample space (the set of outcomes) using characteristics (or categories) of the outcomes, or as unions, intersections, or complements of other events (“or,” “and,” “not”).
DiHSS-CP.A.2. Understand that two events A and B are independent if the probability of A and B occurring together is the product of their probabilities, and use this characterization to determine if they are independent.
DiHSS-CP.A.3. Understand the conditional probability of A given B as P(A and B)/P(B), and interpret independence of A and B as saying that the conditional probability of A given B is the same as the probability of A, and the conditional probability of B given A is the same as the probability of B.
DiHSS-CP.A.4. Construct and interpret two-way frequency tables of data when two categories are associated with each object being classified. Use the two-way table as a sample space to decide if events are independent and to approximate conditional probabilities.
Show details
DiHSS-CP.A.5. Recognize and explain the concepts of conditional probability and independence in everyday language and everyday situations.
Show details
HSS-CP.B. Use the rules of probability to compute probabilities of compound events in a uniform probability model
DiHSS-CP.B.6. Find the conditional probability of A given B as the fraction of B’s outcomes that also belong to A and interpret the answer in terms of the model.
DiHSS-CP.B.7. Apply the Addition Rule, P(A or B) = P(A) + P(B) – P(A and B), and interpret the answer in terms of the model.
DiHSS-CP.B.8. (+) Apply the general Multiplication Rule in a uniform probability model, P(A and B) = P(A)P(B|A) = P(B)P(A|B), and interpret the answer in terms of the model.
DiHSS-CP.B.9. (+) Use permutations and combinations to compute probabilities of compound events and solve problems.
CCSS: Mathematics Unit 8B
CCSS: HS: Stats/Prob
Interpreting Categorical & Quantitative Data
HSS-ID.A. Summarize, represent, and interpret data on a single count or measurement variable
DiHSS-ID.A.1. Represent data with plots on the real number line (dot plots, histograms, and box plots).
DiHSS-ID.A.2. Use statistics appropriate to the shape of the data distribution to compare center (median, mean) and spread (interquartile range, standard deviation) of two or more different data sets.
DiHSS-ID.A.3. Interpret differences in shape, center, and spread in the context of the data sets, accounting for possible effects of extreme data points (outliers).
DiHSS-ID.A.4. Use the mean and standard deviation of a data set to fit it to a normal distribution and to estimate population percentages. Recognize that there are data sets for which such a procedure is not appropriate. Use calculators, spreadsheets and tables to estimate areas under the normal curve.
Making Inferences & Justifying Conclusions
HSS-IC.A. Understand and evaluate random processes underlying statistical experiments
DiHSS-IC.A.1. Understand that statistics is a process for making inferences about population parameters based on a random sample from that population.
DiHSS-IC.A.2. Decide if a specified model is consistent with results from a given data-generating process, e.g. using simulation.
Show details
HSS-IC.B. Make inferences and justify conclusions from sample surveys, experiments and observational studies
DiHSS-IC.B.3. Recognize the purposes of and differences among sample surveys, experiments and observational studies; explain how randomization relates to each.
DiHSS-IC.B.4. Use data from a sample survey to estimate a population mean or proportion; develop a margin of error through the use of simulation models for random sampling.
DiHSS-IC.B.5. Use data from a randomized experiment to compare two treatments; justify significant differences between parameters through the use of simulation models for random assignment.
DiHSS-IC.B.6. Evaluate reports based on data.
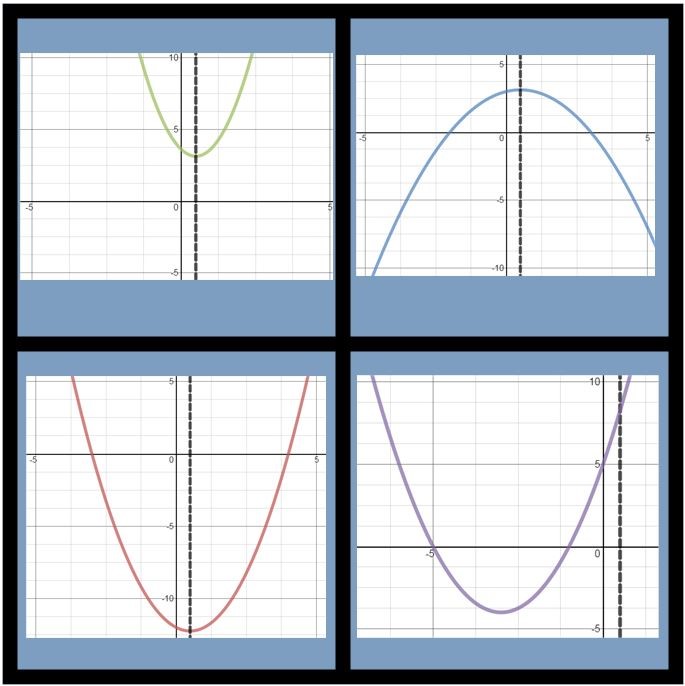
WHICH ONE DOESN'T BELONG wodb.ca/
ADD PDF of Scope and sequence for Alg 1 and Alg 2 T&S
Hand out : Alg 1 ATLAS & SCOPE Alg 2 ATLAS & SCOPE
IC.6 Evaluate reports based on data misleading graphs site misleading graphs online answer reveal
Find TASKs for all of the Standards illustrative mathematics site
Video Lessons LEARN ZILLION HS Probability & Statistics (performance tasks) Against All Odds Video Series
Video Lessons LEARN ZILLION HS Probability & Statistics (performance tasks) Against All Odds Video Series
